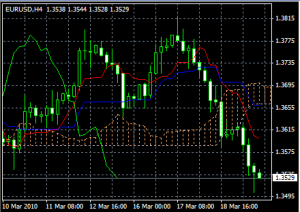
 The Ichimoku Kinko Hyo is a type of technical indicator that has its roots in Japan. Investopedia says that this is,
A technical indicator that is used to gauge momentum along with future areas of support and resistance.
It can be loosely translated to English as “One glance at a chart to see equilibrium” and the power in the IKH indicator comes from the ability to safely predict areas of support, resistance and consolidation when applied to a chart. In the world of Forex, the IKH is a very useful tool for spotting trends and breakouts and can be used in a number of ways to gain a profit from a trade. Although the indicator seems very complicated at first glance, it is simple to understand the idea behind it when you read up on the significance of each of the lines and areas the indicator offers. Assuming competency with the indicator, here are three ways you can use the IKH to generate profit through trading.
The Tenkan Sen / Kijun Sen Cross
Tenkan-sen and Kijun-sen make up the moving parts of the predictive modeling portion of the IKH system. When the Kijun-sen crosses the Tenkan-sen, this can be taken as an indicator of the market about to change. If the Tenkan-sen crosses the Kijun-sen from below to above, this is taken as a bullish signal, and would advise you to buy the pair in question. If the Tenkan-sen crosses the Kijun-sen the opposite way, it signals a bearish trend, suggesting that you sell the pair. These signals cannot be taken in isolation, since the IKH requires the use of other parts of the chart to make a final determination of a position. In this particular situation, using the location of the T-K cross in relation to the kumo-cloud is a good way to determine the strength of the signal. If the cross happens above the cloud, and it is a bullish signal, that enhances its strength, and vice versa for the bearish signal (i.e. it must occur below the cloud with a bearish T-K cross).
Kijun-sen Price Cross
When the price crosses the Kijun-sen, it signals a change in market direction depending on the location of the cross in relation to the kumo cloud. Again, if the cross happens above the cloud and it is a bullish cross, (where the price crosses from below to above the Kijun-sen) it can be taken as a strong indicator of a bullish market movement. If the cross happens below the cloud and it is a bearish cross (where the price crosses from above to below the Kijun-sen) it can be taken as a good indicator of a bearish market movement. Again, in isolation the cross of the price and the Kijun-sen is not enough to determine market movement. The location of the kumo cloud must be taken into account. FXWords says that the inventor of the IKH realized that,
Since support was many layers deep from the offers/bids around the level, he created a cloud to represent the past levels of support/resistance.
Using this to our advantage, we have two very good trading strategies that can benefit immensely by using the kumo-cloud.
The IKH system was developed for use in the stock market and its periodicity is notoriously related to the monthly-range of Japanese stock movement per month. However, when adapted to the Forex with the same parameters, it performs remarkably well. Understanding how the IKH works is essential in using it as a tool to profit. However, you should be aware that the indicator only allows for the probability of a trade being profitable, based on a trending market. In a non-trending market it is very likely that multiple conflicting signals may arise and mess with the viability of the indicator.
Our Rating: [yasr_overall_rating]
