Harmonic trading is a trading method that makes an attempt to predict future movements in the unpredictable currency market. In order to understand how to use harmonic trading, one must understand harmonic patterns and how to take geometric price patterns to a higher level using Fibonacci numbers to determine the exact turning points. This method is unlike other common methods because it is reactionary and it is not based on predictions. Look below for some very detailed price patterns that are used to make trades in currencies on the Forex market. Learn how to use the Golden ratio to make accurate trades.
—————————————–
Combine Geometry and Fibonacci Numbers
Harmonic trading combines patterns and math into a trading method that is precise and based on the premise that patterns repeat themselves. At the root of the methodology is the primary ratio, or some derivative of it (0.618 or 1.618). Complementing ratios include: 0.382, 0.50, 1.41, 2.0, 2.24, 2.618, 3.14 and 3.618. The primary ratio is found in almost all natural and environmental structures and events; it is also found in man-made structures. Since the pattern repeats throughout nature and within society, the ratio is also seen in the financial markets, which are affected by the environments and societies in which they trade.
By finding patterns of varying lengths and magnitudes, the trader can then apply Fibonacci ratios to the patterns and try to predict future movements. The trading method is largely attributed to Scott Carney, although others have contributed or found patterns and levels that enhance performance.
Issues with Harmonics
Harmonic price patterns are extremely precise, requiring the pattern to show movements of a particular magnitude in order for the unfolding of the pattern to provide an accurate reversal point. A trader may often see a pattern that looks like a harmonic pattern, but the Fibonacci levels will not align in the pattern, thus rendering the pattern unreliable in terms of the Harmonic approach. This can be an advantage, as it requires the trader to be patient and wait for ideal set-ups.
Harmonic patterns can gauge how long current moves will last, but they can also be used to isolate reversal points. The danger occurs when a trader takes a position in the reversal area and the pattern fails. When this happens, the trader can be caught in a trade where the trend rapidly extends against them. Therefore, as with all trading strategies, risk must be controlled.
It is important to note that patterns may exist within other patterns, and it is also possible that non-harmonic patterns may (and likely will) exist within the context of harmonic patterns. These can be used to aid in the effectiveness of the harmonic pattern and enhance entry and exit performance. Several price waves may also exist within a single harmonic wave (for instance a CD wave or AB wave). Prices are constantly gyrating; therefore, it is important to focus on the bigger picture of the time frame being traded. The fractal nature of the markets allows the theory to be applied from the smallest to largest time frames.
To use the method, a trader will benefit from a chart platform that allows the trader to plot multiple Fibonacci retracements to measure each wave.
The Visual Patterns and How to Trade Them
There is quite an assortment of harmonic patterns, although there are four that seem most popular. These are the Gartley, butterfly, bat and crab patterns.
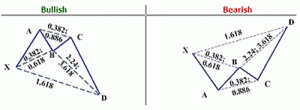
The Gartley was originally published by H.M. Gartley in his book Profits in the Stock Market and the Fibonacci levels were later added by Scott Carney in his book The Harmonic Trader.
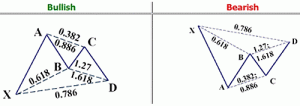
Figure 1: The Gartley Pattern
Source: Harmonictrader.com
The bullish pattern is often seen early in a trend, and it is a sign the corrective waves are ending and an upward move will ensue at point D. All patterns may be within the context of a broader trend or range and traders must be aware of that (see Elliott Wave Theory). Point D is a 0.786 correction of the XA wave, and it is a 1.27 or 1.618 extension of the BC wave. The area at D is known as the potential reversal zone (PRZ). This is where long positions could be entered, as some price confirmation of reversal is encouraged. A stop is placed just below the PRZ.
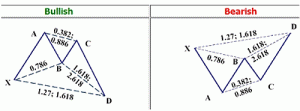
Figure 2: The Butterfly Pattern
Source: Harmonictrader.com
The butterfly pattern is different than the Gartley in that it focuses on finding reversals at new lows (bullish) or new highs (bearish). D is a new low and a potential reversal point if the Fibonacci figures align with the structure. D would need to be an extension of BC in the magnitude of 1.618 or 2.618. This should align with an extension of XA in the magnitude of a 1.27 or 1.618. Entry is taken near D with price confirmation of the reversal encouraged. Stops are placed slightly below the potential reversal area (bullish).
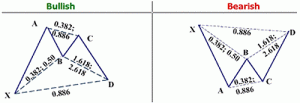
Figure 3: The Bat Pattern
Source: Harmonictrader.com
The bat pattern is similar to Gartley in appearance, but not in measurement. Point B has a smaller retracement of XA of 0.382 or 0.50 (less than 0.618), but the extension of the BC wave into D is at minimum 1.618 and potentially 2.618. Therefore, D will be a 0.886 retracement of the original XA wave. This is the PRZ: when selling has stopped and buying enters the market, enter a long position and take advantage of the bullish pattern. Place a stop just below the PRZ.
The crab is considered by Carney to be one of the most precise of the patterns, providing reversals in extremely close proximity to what the Fibonacci numbers indicate. This pattern, similar to the butterfly, looks to capture a high probability reversal at a new (recent) low or high (bullish or bearish respectively). In a bullish pattern, point B will pullback 0.618 or less of XA. The extension of BC into D is quite large, from 2.24 to 3.618. D (the PRZ) is a 1.618 extension of XA. Entries are made near D with a stop-loss order just outside the PRZ.
Fine-Tuning Entries and Stops
Each pattern provides a PRZ. This is not an exact level, as two measurements – extension or retracement of XA – creates one level at D and the extension of BC creates another level at D. This actually makes D a zone where reversals are likely. Traders will also notice that BC can have differing extension lengths. Therefore, traders must be aware of how far a BC extension may go. If all projected levels are within close proximity, the trader can enter a position at any area. If the zone is spread out, such as on longer-term charts where the levels may be 50 pips or more apart, it is important to wait to see if the price reaches further extension levels of BC before entering a trade.
Stops can be placed outside the largest potential extension of BC. In the crab pattern, for example, this would be 3.618. If the rate reversed before 3.618 was hit, the stop would be moved to just outside the closed Fibonacci level to the rate low (bullish pattern) or rate high (bearish pattern) in the PRZ.
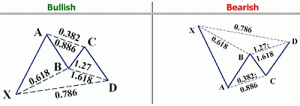
Figure 5 is an intra-day example of a butterfly pattern from May 3, 2011.
Figure 5. Bearish Butterfly Pattern – EUR/USD, 15 Minute
The price touches almost exactly the 1.618 extension level of XA at 1.4892 and the extension of BC to 2.618 is very close at 1.4887 (there are two Fibonacci tools used, one for each wave). This creates a very small PRZ, but it may not always be the case. Entry is taken after the rate enters the zone and then begins to retreat. The stop is placed just outside the most significant level that was not reached by the rate, in this case a few pips above the 1.618 XA extension. Targets can be based on support levels within the pattern; therefore, an initial profit target would be just above point B. (Crowd psychology is the reason this technique works. Find out how to make it work for you. To learn more, refer to Candlesticks Light The Way To Logical Trading.)
————————
The most mathematically precise way to trade is harmonic trading. In order to be successful with this method, you must practice and be patient- much studying is also required to become a master of reading and predicting these types of patterns. When a movement does not align properly with adequate pattern measurement it will become an invalid pattern which many lead traders in the wrong direction. Other patterns to watch for include the Gartley, butterfly, bat, and crab- these are all more commonly known patterns more traders will usually look for. In the potential reversal zone, entries are made when price confirmation shows signs of a reversal, and the stops are then placed out of the closest significant Fibonacci level that wasn’t hit by BC or XA extension into the D area. Each trading platform has its own pros and cons, practicing on fake trades will be beneficial before making a real one.
Are you ready to start using this method to improve your trades?
Our Rating: [yasr_overall_rating]

