Do you remember in math the Fibonacci numbers? Okay, well many haven’t either. Well in trading, especially Forex, this can be an important number. Here’s a video of how to use it.
I have found some sites that go into good detail about it. First off, let’s start with what it is and how it can help.
What are Fibonacci Numbers and the Golden Ratio?
Contents
The Fibonacci sequence first appeared as the solution to a problem in the Liber Abaci, a book written by Leonardo Fibonacci in 1202 to introduce the Hindu-Arabic numerals used today to a Europe still using Roman numerals.
The original problem in the Liber Abaci posed the question: How many pairs of rabbits can be generated from a single pair, if each month each mature pair brings forth a new pair, which, from the second month, becomes productive.
The Golden Ratio
After the first few numbers in the Fibonacci sequence, the ratio of any number to the next higher number is approximately .618, and the lower number is 1.618. These two figures are the golden mean or the golden ratio.
Its proportions are pleasing to the human senses and it appears throughout biology, art, music, and architecture. A few examples of natural shapes based on the Golden Ratio include DNA molecules, sunflowers, snail shells, galaxies, and hurricanes.
Important Retracement Levels
The two Fibonacci percentage retracement levels considered the most important in trading are 38.2% and 62.8%. Other important retracement percentages include 75%, 50%, and 33%. Three Profit Tips for Using Fibonacci Numbers
1. Fibonacci Defines Stop Loss Levels
A trader can use Fibonacci numbers to set stop loss orders.
For instance, if at least three Fibonacci price levels come together in a relatively tight zone, a stop loss placement just below or above the zone may be set.
A Fibonacci number helps define stops in the following way, if a trader trades against a support zone, if the support zone is violated and the price trades below that zone, the reason for the trade is negated and the position should be closed.
Setting stops using Fibonacci retracements takes the emotion out of trading and gives a pre defined exit point.
2. Fibonacci Defines Position Size
Depending on the risk you are prepared to take per trade, Fibonacci numbers can also define position size. For instance, if prices are right on a specific level, you may wish to have more positions than if the price is further away.
3. Fibonacci Defines Objectives
With Fibonacci numbers, once a pattern completes against a Fibonacci price zone you can use them to set profit objectives to bank partial profits or tighten stop loss levels. This clear objective for traders helps them to lock in profits. The great advantage of Fibonacci numbers and the golden ratio is the fact that they take the emotion out of trading and can define not only stop losses to exit a market, but also set profit objectives as well.
=====
That is a good overview but for those who want more detail. Check this out from http://www.forexfibonacci.com/
=====
Fibonacci method in Forex
Straight to the point:
Fibonacci Retracement Levels are:
0.382, 0.500, 0.618 — three the most important levels
Fibonacci retracement levels are used as support and resistance levels.
Fibonacci Extension Levels are:
0.618, 1.000, 1.618 — three the most important levels
Fibonacci extension levels are used as profit taking levels.
So, what we will learn today is how to apply Fibonacci tool and how to interpret results that we see on the screen.
To set up Fibonacci on the chart we need to find out:
1. Is it uptrend or downtrend?
2. Highest and lowest swings in the chart formation (A, B points).
And go with the trend!
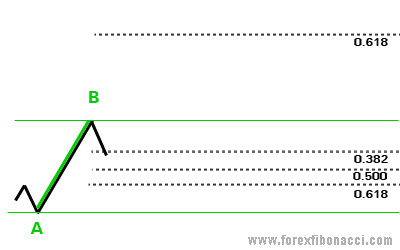
So, click on Fibonacci tool from trading platform that you use. Now, as shown on the Figure 1:

We have an uptrend. A — our lowest swing, B — our highest swing. So, we will look to BUY some lots at the good lowest price and go up with the trend.
Click on A and drag your cursor to B, click. There you go! You must see different lines appeared on your chart. Those lines are called Fibonacci Retracement and Extension Levels.
To calculate Fibonacci levels yourself, refer to How to calculate Fibonacci levels.
So, what we are expecting is next: the price should retrace (go down) from point B to some point C, and then continue up in the direction of the trend.
Those three dotted lines (0.618, 0.500, 0.382) at the bottom on our picture shows three Fibonacci retracement levels where we expect the price to take a U-turn and go up again. There we will place our BUY order.
The best situation would be to buy at the lowest level — 0.618 — point C. And on practice the price usually gives us this chance. However, 0.500 is also a good level to place a BUY order.
image source: http://www.forexfibonacci.com/
=======
Check out the rest of the post at http://www.forexfibonacci.com/. They have some more great information on the method there.
Another great site with Fibonacci Methods for Forex:
http://www.tradingmarkets.com/.site/forex/how_to/articles/-75248.cfm
So what do you guys think? Do you do retracements yourself? Any feedback on that?
If you need help with the getting a good grasp on Forex then I highly recommend you check this out.
Our Rating: [yasr_overall_rating]
